2010 US Construction
Financial Strength Rankings using Artificial Intelligence
| Top rated | 1 of 4 |
| Best rating | 152 % |
| Worst rating | 59.8 % |
| New companies | |
| Negative Economic Capital Ratio |
Financial Strength Rankings using Artificial Intelligence
| Top rated | 1 of 4 |
| Best rating | 152 % |
| Worst rating | 59.8 % |
| New companies | |
| Negative Economic Capital Ratio |
| Revenues | 37.4 B |
| Assets | 19.8 B |
| Expenses | 35.9 B |
| Stockholders Equity | 10.2 B |
| Unprofitable Companies |
| Rank | Company | Seal | Rating Value | Trend | ||
|---|---|---|---|---|---|---|
 | 1 | Quanta Services INC |  | 152.03% | 0.0 |  |
 | 2 | Fluor Corp | 110.31% | 0.0 | | |
 | 3 | KBR INC. | 91.39% | 0.0 | | |
 | 4 | Foster Wheeler Ag | 59.80% | 0.0 | | |
| Rank | Company | Seal | Rating Value | Trend |
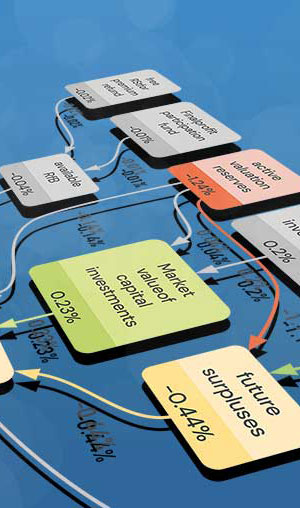
The Feature Distribution shows the main industry variables and the distribution of their impact on financial strength. The more important a variable, the broader the distribution. As the effects are calculated relative to the industry average, half of the companies have a positive effect (green) and half have a negative effect (red).


This year's rating information is fee-based. Please request rates at
james.woods@realrate.ai